The main reason the Orenda Calculator® gives different results (for LSI and chemical doses) is because of the depth and precision of our formulas. Rather than relying on LSI reference charts, we factor in more known variables that are as close as possible to Dr. Langelier's index.
Reference charts are very helpful, because the actual math to calculate the saturation index is extraordinarily complex (see below). The charts democratized it so anyone can do it with simple multiplication of factors, addition and subtraction.
A good way to think of the charts is they are a helpful shortcut, much like Cliffnotes or Sparknotes summarize a book and its main themes. Most LSI calculators are built on the simplified charts, and do not follow the actual math in depth. Ours did too, until we updated the formula in version 3.0. Since then, the Orenda Calculator® does not use the shortcuts. We have technology on our side to be able to process the complex math in real-time. THAT is why our results differ from reference charts.
To be clear, we have not changed anything. We are using the accepted formula exactly as it is written, which we elaborate on in this article.
Dr. Langelier's original saturation index
The original Langelier Saturation Index (LSI), was devised by Dr. Wilfred Langelier. His original publication was:
- Langelier, W. F. (1936). The Analytical Control of Anti-Corrosion Water Treatment. Journal of the American Water Works Association. 28(10), 1500-1521. https://doi.org/10.1002/j.1551-8833.1936.tb13785.x
The reference charts used by various swimming pool trade associations today have been updated over the years. Dr. Langelier worked with water treatment systems, focusing on drinking water for large municipalities. According to his 1936 paper, the intention behind developing his saturation index was to deliberately coat the inside of iron and galvanized pipes with a thin layer of calcium carbonate, inhibiting corrosion of the pipes themselves. To do this, a slight oversaturation of calcium carbonate was needed.
His original formula was as follows:
Saturation index = pH - pHs
It looks simple enough, but the value for "pHs" is quite complex. Read his paper, and you will see what we mean. It uses all sorts of variables, including thermodynamic constants and equilibrium constants, even those for ion pairs such as sodium chloride, calcium chloride, and other salts. These were all factored into pHs . The "s" stands for Saturation.
In simplified terms, the saturation index equals pH (actual) minus the pH at ideal calcium and alkalinity Saturation. Here's an excerpt from Dr. Langelier's paper:
"The derivation of the equation for pHs , which is the pH at which a water of given calcium content and alkalinity is in equilibrium (neither over nor under-saturated with calcium carbonate) is based upon three well-known mass law equations and one stoichiometric equation, as follows...."
He then writes out four complex equations that we don't even know how to type on a keyboard. Take a look for yourself with this helpful article.
Needless to say, without a Ph.D. in chemistry, good luck doing these equations by hand. It's not practical, especially every time you visit a swimming pool and adjust its chemistry.
Thankfully, the equation was simplified in 1965 by Carrier, based on a paper written in 1964 by Van Waters & Rogers:
- Van Waters & Rogers. (1964). Scale Formation and pH Control in Swimming Pools. Technical Information Bulletin, FK 41464.
This update converted the complex equation into a reference chart for the first time, and that was the birth of what most people think of when they see the LSI formula. This chart with multiplier factors was necessary to make this concept usable for most people.
That said, the reference charts have been updated and modified several times since 1965. Among these updates, the formula was adapted to swimming pools to include variables like cyanuric acid (CYA). To make a long story short, the evolution of the reference charts used today involved these studies, including the two already mentioned.
- Larson, T. E., Buswell, A. M., Ludwig, H. F., & Langelier, W. F. (1942). Calcium Carbonate Saturation Index and Alkalinity Interpretations [with Discussion]. Journal (American Water Works Association). 34(11), 1667–1684. http://www.jstor.org/stable/41233315
- Plummer, L.N., Busenberg, E. (1982). The solubilities of calcite, aragonite, and vaterite in CO2-H2O solutions between 0 and 90°C, and an evaluation of the aqueous model for the system CaCO3-CO2-H2O. Geochimica et Cosmochimica Acta. 46(6), 1011-1040. https://doi.org/10.1016/0016-7037(82)90056-4
- Wojtowicz, J. (1998). Factors Affecting the Calcium Carbonate Saturation Index. Journal of the Swimming Pool and Spa Industry. 1(2), 9-15.
- Wojtowicz, J. (2001). A Revised and Updated Saturation Index Equation. Journal of the Swimming Pool and Spa Industry. 3(1), 28-34.
Interestingly enough, our industry trade organizations cite the revised and updated Wojtowicz paper, but the published chart does not reflect the updates. It still reflects the 1998 Wojtowicz formula chart (found in Table 6 in his paper). Specifically, the temperature factors are different.
One of the swimming pool and spa industry's trade organizations published a fact sheet about water balance indexes. That document cites these Wojtowicz papers as the accepted basis for the update LSI formula that had been adapted to swimming pools. The Orenda Calculator® uses Wojtowicz's formula.
How precise is the LSI reference table?
It should be noted that Wojtowicz's paper cites the previous studies and all the math involved in coming to these formulas. It is a fascinating read if you're into chemistry. Dr. Langelier's original formula was not limited by listed multiplier factors...it allowed for incredibly precise numbers. His formula allows for inputting numbers as specific and precise as you want. You can even input factors with multiple decimal places.
Contrast that with the reference chart (in the next section of this article).
Wojtowicz's original 1998 formula was built upon Van Waters & Rogers (1964). The revised paper in 2001 mentions ionic strength, particularly concerning Total Dissolved Solids (TDS), and temperature's impact on these variables. Not all ions in water are charged, and our calculator accounts for that.
All that is to say, most LSI charts and apps available today are based on the factors in the reference chart that came from these studies (shown below).
The evolution of the Orenda Calculator®
In 2017, we released the Orenda App for the first time, and we also published a version of this LSI chart on our website:
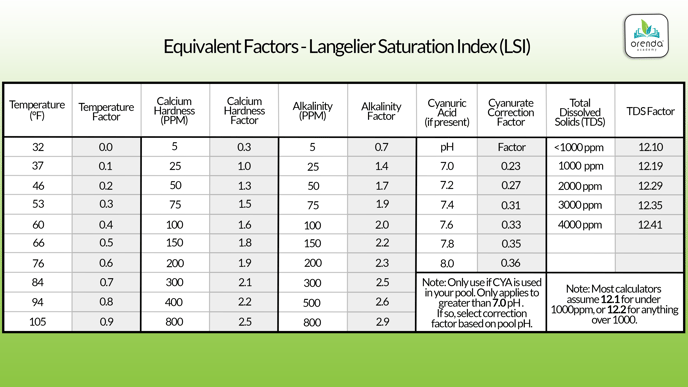
These values came from open-source information online from pool industry trade organizations. The issue with this chart is that it's an adapted, simplified version of the original formula. It's generally considered "close enough", and we agree with that...but we also insisted upon having the most accurate LSI calculator in the world. So "close enough" was not enough for us.
Let's go back up to the chart and look at water temperature, for example. There are factors for 32, 27, 46, 53, 60, 66, 76, 84, 94, and 105ºF. Nothing in between. So when your temperature lands between two of these factors, what should you actually use in your LSI calculation? There are 10 degrees of mystery between 84 and 94º, yet only 0.1 difference in LSI factor.
Our original Orenda Calculator® used these values. At the time, we had no reason to question them. After all, they were originally from the aforementioned sources. As of today, other LSI calculators and industry associations use these values too.
Later in 2017, we updated the formula by mathematically interpolating between the factors on the chart. That update brought more precision to the LSI, and it began to noticeably differentiate Orenda from other calculators and charts in the pool industry. At the time, no other calculator was doing what we were doing. The results were all based on the original factors chart.
Fast forward a few years, and we made another minor formula update. This time, we updated the TDS factor. This further improved precision, though the impact on the LSI was hardly even noticeable.
Orenda version 3.0's major formula update
In 2022, we made a major update to the Orenda Calculator®. We recognized that an LSI formula using reference charts––even when we interpolated between the factors––was still not fully correct. We learned our formula was not accounting for ion pairs. Wojtowicz wrote a paper on these ion pairs here:
- Wojtowicz, J. (2001). Corrections, Potential Errors, and Significance of the Saturation Index. Journal of the Swimming Pool and Spa Industry. 3(1), 37–40.
We decided to fundamentally update our formula to account for specific ion pairs and thermodynamic, temperature-dependent data for each substance. Dosing charts do not go to these lengths, which further differentiates our LSI results from everyone else.
LSI tables and other apps will tend to have higher LSI results than ours because:
- Their values are based on an old 1964 set of table factors, not the updated values from Wojtowicz in 2001.
- We use temperature-dependent equilibrium constants based on standard thermodynamic tables, and
- We account for ion pairs.
We are currently discussing further modifying our formula to lean more on the Plummer and Busenberg (1982) formulas but also accounting for ion pairs. This would slightly differ from the thermodynamic tables we use today. Whatever we decide to do, it will always be to deliver the most precise LSI and chemical dosing calculations possible.
Pool chemical dosing charts also lack precision
If you don't have exactly a 10,000, 15,000, 20,000, or 25,000-gallon pool, dosing charts are limited in accuracy. Charts tend to go up in increments of several thousand gallons (usually 5,000 gallons). So what about a 17,240-gallon pool?
Furthermore, not all chemicals have the same density. So when measuring by weight or by volume, there are differences that most charts do not even mention. We didn't even realize this ourselves, as our app used to use dosing charts and interpolate between factors (just like we did with LSI). And it was close but not precise.
We now factor in the density, weight, and volume of the exact chemicals prescribed. For chlorine products, we factor in their molar weights and product percentages too. We also factor in other chemistries in the water that will change how much a given chemical will affect the water.
The Orenda Calculator® now uses specific, detailed formulas for every factor
Without boring you with the details, just know that the LSI and chemical dosing results you see in the Orenda Calculator® today are the most precise we know how to make them. And you will see slight differences when comparing our app to others (or even our old app before version 3.0 and beyond.